Problems: IO Cost Model
Reference
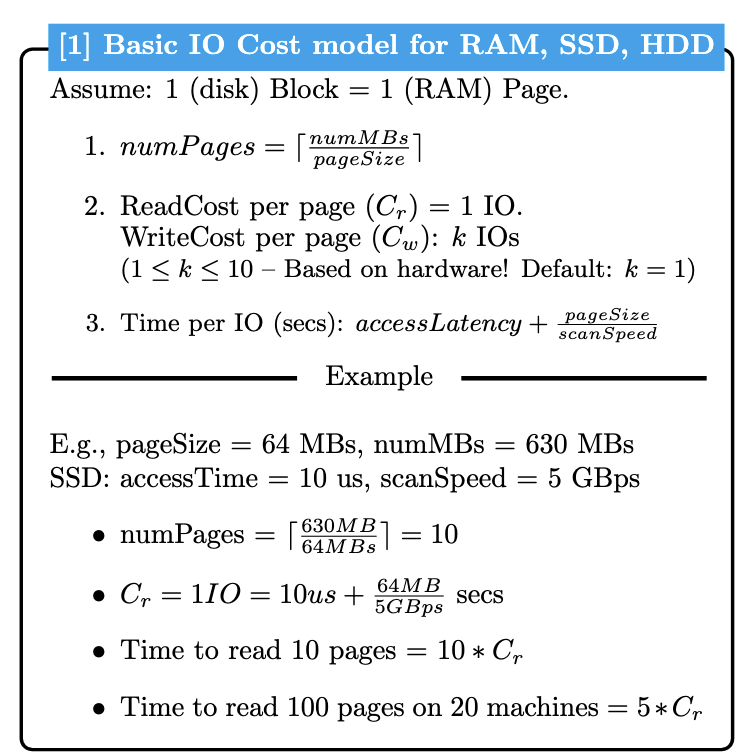
See the IO Reference Sheet for official formulas and notation.
Setup
System Configuration:
-
Page Size: 64 MB
-
Spotify Songs Table: 500 million rows × 1024 bytes/row
-
Formulas and Device Specs: See IO Reference Sheet for complete C_r/C_w formulas
Quick Reference (64MB pages):
| Device | C_r = C_w | Access + Transfer |
|---|---|---|
| RAM | 0.00064s | 100ns + 64MB/100GB/s |
| SSD | 0.01281s | 10μs + 64MB/5GB/s |
| HDD | 0.65s | 10ms + 64MB/100MB/s |
| Network | 0.00641s | 1μs + 64MB/10GB/s |
Problem 1: Table Size Calculation
The Spotify Songs table has 500 million rows with an average row size of 1024 bytes. Calculate:
-
Total size in MB
-
Number of 64 MB pages needed
🔍 Show Solution
Step 1: Calculate Total Size
Total Size = NumRows × RowSize
         = 500,000,000 × 1024 bytes
         = 512,000,000,000 bytes
         = 512,000,000,000 / 1,000,000 MB
         = 512,000 MB = 512 GB
Step 2: Calculate Number of Pages
numPages = Total Size / Page Size
        = 512,000 MB / 64 MB
        = 8,000 pages
Answer
✅ Size: 512,000 MB (512 GB) | numPages: 8,000
Problem 2: Read Cost Comparison
Calculate the time (in seconds) to read 100 pages from different storage devices.
🔍 Show Solution
For Each Device:
Cost = numPages × C_r where C_r includes both access time and transfer time: C_r = Access Time + PageSize / Scan Speed
RAM:
Cost = numPages × C_r = 100 × (100×10⁻⁹ + 64MB/100GB/s)
     = 100 × (0.0000001 + 0.00064)
     = 100 × 0.0006401
     = 0.064 seconds
SSD:
Cost = numPages × C_r = 100 × (10×10⁻⁶ + 64MB/5GB/s)
     = 100 × (0.00001 + 0.0128)
     = 100 × 0.01281
     = 1.281 seconds
HDD:
Cost = numPages × C_r = 100 × (10×10⁻³ + 64MB/100MB/s)
     = 100 × (0.01 + 0.64)
     = 100 × 0.65
     = 65 seconds
Answer
| Device | Time (seconds) | Relative Speed |
|---|---|---|
| RAM | 0.064 | 1× (fastest) |
| SSD | 1.281 | 20× slower |
| HDD | 65.0 | 1,016× slower |
Problem 3: Cache Hit Rate Impact
You need to read 200 pages with the following cache hierarchy:
-
Check RAM first for all pages (90% hit rate)
-
For RAM misses (10%): 75% found in SSD, 25% in HDD
Calculate the total read time, including the cost of checking RAM.
🔍 Show Solution
Step 1: Check RAM for ALL pages
Must check RAM for all 200 pages to determine hits/misses
RAM Check Cost = numPages × C_r = 200 × (100ns + 64MB/100GB/s)
               = 200 × 0.00064 = 0.128 seconds

Results: 180 pages found (90% hit), 20 pages miss (10%)
Step 2: Fetch misses from lower levels
Of the 20 misses:
  → 15 pages (75%) found in SSD
  → 5 pages (25%) found in HDD

SSD Fetch Cost = numPages × C_r = 15 × (10μs + 64MB/5GB/s)
               = 15 × 0.01281 = 0.192 seconds

HDD Fetch Cost = numPages × C_r = 5 × (10ms + 64MB/100MB/s)
               = 5 × 0.65 = 3.25 seconds
Step 3: Total Cost
Total = RAM Check + SSD Fetch + HDD Fetch
      = 0.128 + 0.192 + 3.25 = 3.57 seconds
Answer
✅ Total time: 3.57 seconds
Key Insights:
-
You ALWAYS pay the cost to check RAM for all pages - this is how caching works!
-
Even with 90% cache hit rate, the 2.5% that goes to HDD (5 out of 200 pages) dominates the total cost!
Problem 4: Mixed Read/Write Operations
You need to:
-
Read 30 pages
-
Write 10 pages
Calculate total cost for each storage device.
🔍 Show Solution
Cost Formula
For mixed operations, calculate each separately:
Total = Read Cost + Write Cost
      = numPages(read) × C_r + numPages(write) × C_w
      = 30 × C_r + 10 × C_w
Since read and write costs are equal for these devices: C_r = C_w
Total = (30 + 10) × C_r = 40 × C_r
RAM:
Cost = 40 × C_r = 40 × 0.00064s = 0.026 seconds
SSD:
Cost = 40 × C_r = 40 × 0.01281s = 0.512 seconds
HDD:
Cost = 40 × C_r = 40 × 0.65s = 26 seconds
Problem 5: Network vs Local Storage
Compare reading 1 page from:
-
Local RAM
-
Local SSD
-
Local HDD
-
Network RAM (RAM on another machine)
🔍 Show Solution
Local Storage Costs
Local RAM:
Cost = numPages × C_r = 1 × (100ns + 64MB/100GB/s)
     = 1 × (0.0000001s + 0.00064s)
     = 0.0006401 seconds
Local SSD:
Cost = numPages × C_r = 1 × (10μs + 64MB/5GB/s)
     = 1 × (0.00001s + 0.0128s)
     = 0.01281 seconds
Local HDD:
Cost = numPages × C_r = 1 × (10ms + 64MB/100MB/s)
     = 1 × (0.01s + 0.64s)
     = 0.65 seconds
Network RAM Cost
Three steps: Read from remote RAM → Network transfer → Write to local RAM
Remote RAM read:  numPages × C_r = 1 × 0.0006401 = 0.0006401 seconds
Network transfer: numPages × C_network = 1 × (1μs + 64MB/10GB/s)
                = 1 × (0.000001 + 0.0064) = 0.006401 seconds
Local RAM write:  numPages × C_w = 1 × 0.0006401 = 0.0006401 seconds
Total:           0.0006401 + 0.006401 + 0.0006401 = 0.0076812 seconds
Answer
| Storage Type | Time (seconds) | Relative to Local RAM |
|---|---|---|
| Local RAM | 0.00064 | 1× (baseline) |
| Network RAM | 0.0077 | 12× slower |
| Local SSD | 0.0128 | 20× slower |
| Local HDD | 0.65 | 1,016× slower |
Key Insight: With modern 10GB/s networks, Network RAM is faster than Local SSD! This is why distributed caching works so well.
Let's Transition to Algorithm Design
You now understand the physics! For the rest of this course:
- Ignore device differences - focus on IO patterns and algorithm complexity
- Count IOs, not seconds: C_r = C_w = 1 IO (abstract unit)
- Algorithm X reads 100 pages → Cost = 100 IOs
- Algorithm Y reads 2×N pages → Cost = 2N IOs
This lets us compare algorithms independent of hardware. When we say "Algorithm A costs 5N IOs" vs "Algorithm B costs N log N IOs", we can compare algorithms based on data size N.
Example:
- Hash Join: 3N IOs (linear)
- Nested Loop Join: N² IOs (quadratic)
- For N=1000: Hash Join wins (3,000 vs 1,000,000 IOs)
Key Takeaways
-
HDDs and SSDs are much slower than RAM for random access
-
Cache hit rates matter enormously - even 5% HDD access can dominate
-
Network RAM ≈ Local SSD in performance
-
Page size affects random access penalty - larger pages amortize seek cost
-
Moving forward: We'll count IOs (1 page = 1 IO) to analyze algorithm complexity